A Tool to Help Correct Misconceptions
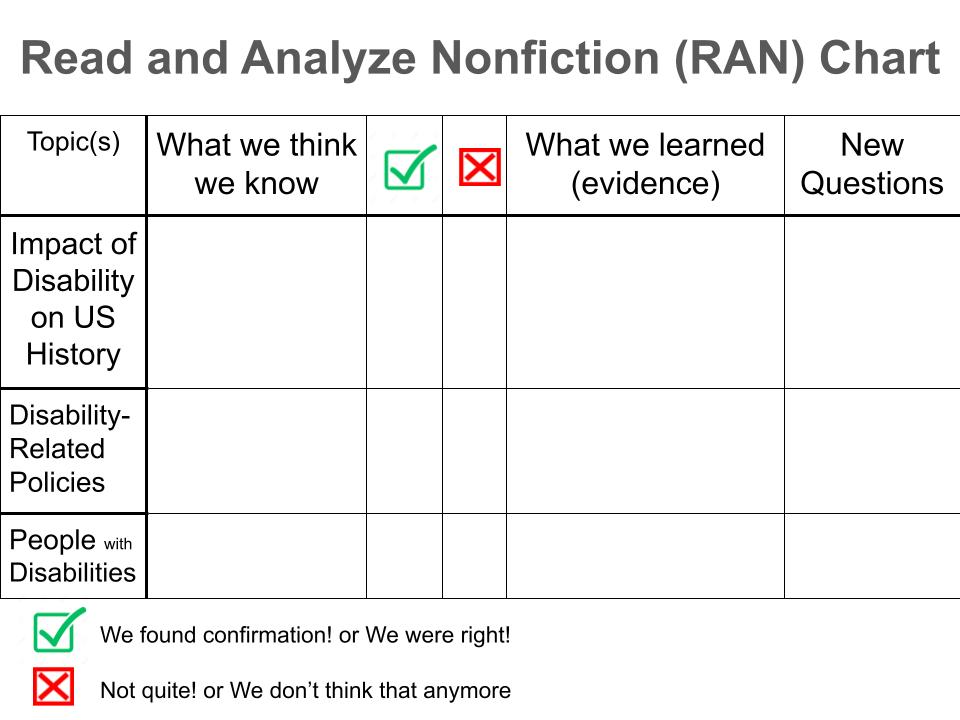
The point of the RAN Chart (RAN stands for "Read and Analyze Non-fiction") is for students to research and confirm or correct their ideas for themselves! (Thus the RAN Chart improves on the old "Know-Wonder-Learned / KWL" chart.)
Step 1: Draw the RAN Chart on a whiteboard or smart board, or arrange note cards or post-its on a RAN Chart template. Ideally, leave the RAN Chart up through throughout an investigation. Create categories to help categorize the important ideas and information of the topic.
Step 2: Students brainstorm together, "What we THINK we know?" about a topic. The beauty of the RAN Chart is that the teacher does not have to judge or correct any statements for accuracy.
Step 3: As the lesson or investigation proceeds, move initial beliefs or add comments as they are confirmed ("Yes!") or corrected ("Oops!"). Before any statement moves, students must present and note the evidence. In the example on American Slavery, most of the evidence comes from listening to the oral history recording of formerly enslaved Fountain Hughes.* Students note that as Hughes described it, "Emancipation was not as glorious as often pictured."
This RAN Chart uses cartoon images to strengthen concept recognition for students with weak reading skills.
Example: RAN Chart on American Slavery
The first few times you use the tool, the teacher should always be the one to write and place ideas. Students can suggest when it is time to move to the "Yes!"–"confirmed" or "Oops!"–"we don't think that anymore" columns. Students must always present and make note of their evidence.
*A recording of Fountain Hughes, including a typed transcript, may be found at the Library of Congress. https://www.loc.gov/item/afc1950037_afs09990a


